Bayesian statistics and clinical trial conclusions: Why the OPTIMSE study should be considered positive

Statistical approaches to randomised controlled trial analysis

The statistical approach used in the design and analysis of the vast majority of clinical studies is often referred to as classical or frequentist. Conclusions are made on the results of hypothesis tests with generation of p-values and confidence intervals, and require that the correct conclusion be drawn with a high probability among a notional set of repetitions of the trial.

Bayesian inference is an alternative, which treats conclusions probabilistically and provides a different framework for thinking about trial design and conclusions. There are many differences between the two, but for this discussion there are two obvious distinctions with the Bayesian approach. The first is that prior knowledge can be accounted for to a greater or lesser extent, something life scientists sometimes have difficulty reconciling. Secondly, the conclusions of a Bayesian analysis often focus on the decision that requires to be made, e.g. should this new treatment be used or not.

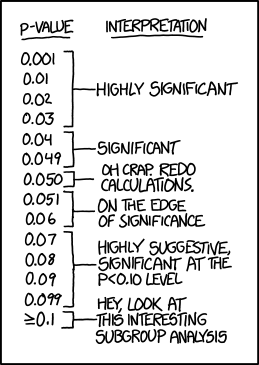
There are pros and cons to both sides, nicely discussed here, but I would argue that the results of frequentist analyses are too often accepted with insufficient criticism. Here’s a good example.

OPTIMSE: Optimisation of Cardiovascular Management to Improve Surgical Outcome

Optimising the amount of blood being pumped out of the heart during surgery may improve patient outcomes. By specifically measuring cardiac output in the operating theatre and using it to guide intravenous fluid administration and the use of drugs acting on the circulation, the amount of oxygen that is delivered to tissues can be increased.

It sounds like common sense that this would be a good thing, but drugs can have negative effects, as can giving too much intravenous fluid. There are also costs involved, is the effort worth it? Small trials have suggested that cardiac output-guided therapy may have benefits, but the conclusion of a large Cochrane review was that the results remain uncertain.

A well designed and run multi-centre randomised controlled trial was performed to try and determine if this intervention was of benefit (OPTIMSE: Optimisation of Cardiovascular Management to Improve Surgical Outcome).

Patients were randomised to a cardiac output–guided hemodynamic therapy algorithm for intravenous fluid and a drug to increase heart muscle contraction (the inotrope, dopexamine) during and 6 hours following surgery (intervention group) or to usual care (control group).

The primary outcome measure was the relative risk (RR) of a composite of 30-day moderate or major complications and mortality.

OPTIMSE: reported results

Focusing on the primary outcome measure, there were 158/364 (43.3%) and 134/366 (36.6%) patients with complication/mortality in the control and intervention group respectively. Numerically at least, the results appear better in the intervention group compared with controls.

Using the standard statistical approach, the relative risk (95% confidence interval) = 0.84 (0.70-1.01), p=0.07 and absolute risk difference = 6.8% (−0.3% to 13.9%), p=0.07. This is interpreted as there being insufficient evidence that the relative risk for complication/death is different to 1.0 (all analyses replicated below). The authors reasonably concluded that:

In a randomized trial of high-risk patients undergoing major gastrointestinal surgery, use of a cardiac output–guided hemodynamic therapy algorithm compared with usual care did not reduce a composite outcome of complications and 30-day mortality.

A difference does exist between the groups, but is not judged to be a sufficient difference using this conventional approach.

OPTIMSE: Bayesian analysis

Repeating the same analysis using Bayesian inference provides an alternative way to think about this result. What are the chances the two groups actually do have different results? What are the chances that the two groups have clinically meaningful differences in results? What proportion of patients stand to benefit from the new intervention compared with usual care?

With regard to prior knowledge, this analysis will not presume any prior information. This makes the point that prior information is not always necessary to draw a robust conclusion. It may be very reasonable to use results from pre-existing meta-analyses to specify a weak prior, but this has not been done here. Very grateful to John Kruschke for the excellent scripts and book, Doing Bayesian Data Analysis.

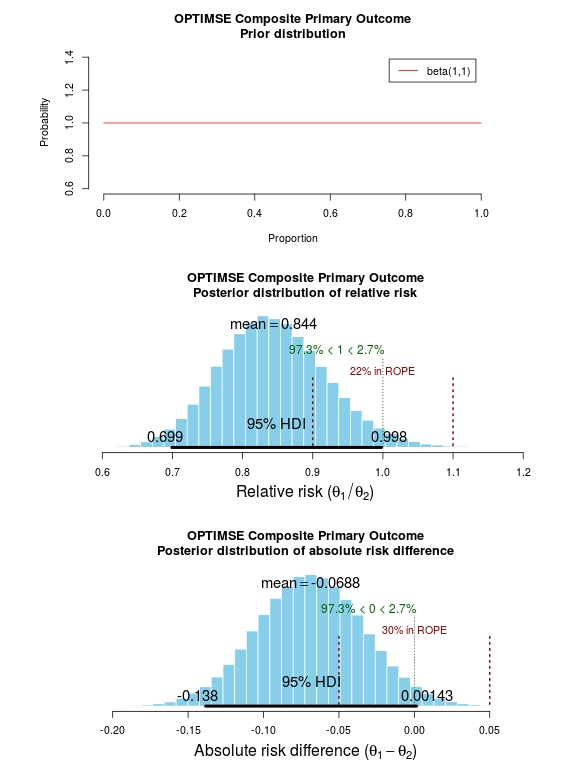
The results of the analysis are presented in the graph below. The top panel is the prior distribution. All proportions for the composite outcome in both the control and intervention group are treated as equally likely.

The middle panel contains the main findings. This is the posterior distribution generated in the analysis for the relative risk of the composite primary outcome (technical details in script below).

The mean relative risk = 0.84 which as expected is the same as the frequentist analysis above. Rather than confidence intervals, in Bayesian statistics a credible interval or region is quoted (HDI = highest density interval is the same). This is philosphically different to a confidence interval and says:

Given the observed data, there is a 95% probability that the true RR falls within this credible interval.

This is a subtle distinction to the frequentist interpretation of a confidence interval:

Were I to repeat this trial multiple times and compute confidence intervals, there is a 95% probability that the true RR would fall within these confidence intervals.

This is an important distinction and can be extended to make useful probabilistic statements about the result.

The figures in green give us the proportion of the distribution above and below 1.0. We can therefore say:

The probability that the intervention group has a lower incidence of the composite endpoint is 97.3%.

It may be useful to be more specific about the size of difference between the control and treatment group that would be considered equivalent, e.g. 10% above and below a relative risk = 1.0. This is sometimes called the region of practical equivalence (ROPE; red text on plots). Experts would determine what was considered equivalent based on many factors. We could therefore say:

The probability of the composite end-point for the control and intervention group being equivalent is 22%.

Or, the probability of a clinically relevant difference existing in the composite endpoint between control and intervention groups is 78%
optimise_primary_bayesFinally, we can use the 200 000 estimates of the probability of complication/death in the control and intervention groups that were generated in the analysis (posterior prediction). In essence, we can act like these are 2 x 200 000 patients. For each “patient pair”, we can use their probability estimates and perform a random draw to simulate the occurrence of complication/death. It may be useful then to look at the proportion of “patients pairs” where the intervention patient didn’t have a complication but the control patient did:

Using posterior prediction on the generated Bayesian model, the probability that a patient in the intervention group did not have a complication/death when a patient in the control group did have a complication/death is 28%.

Conclusion

On the basis of a standard statistical analysis, the OPTIMISE trial authors reasonably concluded that the use of the intervention compared with usual care did not reduce a composite outcome of complications and 30-day mortality.

Using a Bayesian approach, it could be concluded with 97.3% certainty that use of the intervention compared with usual care reduces the composite outcome of complications and 30-day mortality; that with 78% certainty, this reduction is clinically significant; and that in 28% of patients where the intervention is used rather than usual care, complication or death may be avoided.

# OPTIMISE trial in a Bayesian framework
# JAMA. 2014;311(21):2181-2190. doi:10.1001/jama.2014.5305
# Ewen Harrison
# 15/02/2015

# Primary outcome: composite of 30-day moderate or major complications and mortality
N1 <- 366
y1 <- 134
N2 <- 364
y2 <- 158
# N1 is total number in the Cardiac Output–Guided Hemodynamic Therapy Algorithm (intervention) group
# y1 is number with the outcome in the Cardiac Output–Guided Hemodynamic Therapy Algorithm (intervention) group
# N2 is total number in usual care (control) group
# y2 is number with the outcome in usual care (control) group

# Risk ratio
(y1/N1)/(y2/N2)

library(epitools)
riskratio(c(N1-y1, y1, N2-y2, y2), rev="rows", method="boot", replicates=100000)

# Using standard frequentist approach
# Risk ratio (bootstrapped 95% confidence intervals) = 0.84 (0.70-1.01) 
# p=0.07 (Fisher exact p-value)

# Reasonably reported as no difference between groups.

# But there is a difference, it just not judged significant using conventional
# (and much criticised) wisdom.

# Bayesian analysis of same ratio
# Base script from John Krushcke, Doing Bayesian Analysis

#------------------------------------------------------------------------------
source("~/Doing_Bayesian_Analysis/openGraphSaveGraph.R")
source("~/Doing_Bayesian_Analysis/plotPost.R")
require(rjags) # Kruschke, J. K. (2011). Doing Bayesian Data Analysis, Academic Press / Elsevier.
#------------------------------------------------------------------------------
# Important
# The model will be specified with completely uninformative prior distributions (beta(1,1,).
# This presupposes that no pre-exisiting knowledge exists as to whehther a difference
# may of may not exist between these two intervention. 

# Plot Beta(1,1)
# 3x1 plots
par(mfrow=c(3,1))
# Adjust size of prior plot
par(mar=c(5.1,7,4.1,7))
plot(seq(0, 1, length.out=100), dbeta(seq(0, 1, length.out=100), 1, 1), 
         type="l", xlab="Proportion",
         ylab="Probability", 
         main="OPTIMSE Composite Primary Outcome\nPrior distribution", 
         frame=FALSE, col="red", oma=c(6,6,6,6))
legend("topright", legend="beta(1,1)", lty=1, col="red", inset=0.05)

# THE MODEL.
modelString = "
# JAGS model specification begins here...
model {
# Likelihood. Each complication/death is Bernoulli. 
for ( i in 1 : N1 ) { y1[i] ~ dbern( theta1 ) }
for ( i in 1 : N2 ) { y2[i] ~ dbern( theta2 ) }
# Prior. Independent beta distributions.
theta1 ~ dbeta( 1 , 1 )
theta2 ~ dbeta( 1 , 1 )
}
# ... end JAGS model specification
" # close quote for modelstring

# Write the modelString to a file, using R commands:
writeLines(modelString,con="model.txt")


#------------------------------------------------------------------------------
# THE DATA.

# Specify the data in a form that is compatible with JAGS model, as a list:
dataList =  list(
    N1 = N1 ,
    y1 = c(rep(1, y1), rep(0, N1-y1)),
    N2 = N2 ,
    y2 = c(rep(1, y2), rep(0, N2-y2))
)

#------------------------------------------------------------------------------
# INTIALIZE THE CHAIN.

# Can be done automatically in jags.model() by commenting out inits argument.
# Otherwise could be established as:
# initsList = list( theta1 = sum(dataList$y1)/length(dataList$y1) , 
#                   theta2 = sum(dataList$y2)/length(dataList$y2) )

#------------------------------------------------------------------------------
# RUN THE CHAINS.

parameters = c( "theta1" , "theta2" )     # The parameter(s) to be monitored.
adaptSteps = 500              # Number of steps to "tune" the samplers.
burnInSteps = 1000            # Number of steps to "burn-in" the samplers.
nChains = 3                   # Number of chains to run.
numSavedSteps=200000           # Total number of steps in chains to save.
thinSteps=1                   # Number of steps to "thin" (1=keep every step).
nIter = ceiling( ( numSavedSteps * thinSteps ) / nChains ) # Steps per chain.
# Create, initialize, and adapt the model:
jagsModel = jags.model( "model.txt" , data=dataList , # inits=initsList , 
        n.chains=nChains , n.adapt=adaptSteps )
# Burn-in:
cat( "Burning in the MCMC chain...\n" )
update( jagsModel , n.iter=burnInSteps )
# The saved MCMC chain:
cat( "Sampling final MCMC chain...\n" )
codaSamples = coda.samples( jagsModel , variable.names=parameters , 
        n.iter=nIter , thin=thinSteps )
# resulting codaSamples object has these indices: 
#   codaSamples[[ chainIdx ]][ stepIdx , paramIdx ]

#------------------------------------------------------------------------------
# EXAMINE THE RESULTS.

# Convert coda-object codaSamples to matrix object for easier handling.
# But note that this concatenates the different chains into one long chain.
# Result is mcmcChain[ stepIdx , paramIdx ]
mcmcChain = as.matrix( codaSamples )

theta1Sample = mcmcChain[,"theta1"] # Put sampled values in a vector.
theta2Sample = mcmcChain[,"theta2"] # Put sampled values in a vector.

# Plot the chains (trajectory of the last 500 sampled values).
par( pty="s" )
chainlength=NROW(mcmcChain)
plot( theta1Sample[(chainlength-500):chainlength] ,
            theta2Sample[(chainlength-500):chainlength] , type = "o" ,
            xlim = c(0,1) , xlab = bquote(theta[1]) , ylim = c(0,1) ,
            ylab = bquote(theta[2]) , main="JAGS Result" , col="skyblue" )

# Display means in plot.
theta1mean = mean(theta1Sample)
theta2mean = mean(theta2Sample)
if (theta1mean > .5) { xpos = 0.0 ; xadj = 0.0
} else { xpos = 1.0 ; xadj = 1.0 }
if (theta2mean > .5) { ypos = 0.0 ; yadj = 0.0
} else { ypos = 1.0 ; yadj = 1.0 }
text( xpos , ypos ,
            bquote(
                "M=" * .(signif(theta1mean,3)) * "," * .(signif(theta2mean,3))
            ) ,adj=c(xadj,yadj) ,cex=1.5  )

# Plot a histogram of the posterior differences of theta values.
thetaRR = theta1Sample / theta2Sample # Relative risk
thetaDiff = theta1Sample - theta2Sample # Absolute risk difference

par(mar=c(5.1, 4.1, 4.1, 2.1))
plotPost( thetaRR , xlab= expression(paste("Relative risk (", theta[1]/theta[2], ")")) , 
    compVal=1.0, ROPE=c(0.9, 1.1),
    main="OPTIMSE Composite Primary Outcome\nPosterior distribution of relative risk")
plotPost( thetaDiff , xlab=expression(paste("Absolute risk difference (", theta[1]-theta[2], ")")) ,
    compVal=0.0, ROPE=c(-0.05, 0.05),
    main="OPTIMSE Composite Primary Outcome\nPosterior distribution of absolute risk difference")

#-----------------------------------------------------------------------------
# Use posterior prediction to determine proportion of cases in which 
# using the intervention would result in no complication/death 
# while not using the intervention would result in complication death 

chainLength = length( theta1Sample )

# Create matrix to hold results of simulated patients:
yPred = matrix( NA , nrow=2 , ncol=chainLength ) 

# For each step in chain, use posterior prediction to determine outcome
for ( stepIdx in 1:chainLength ) { # step through the chain
    # Probability for complication/death for each "patient" in intervention group:
    pDeath1 = theta1Sample[stepIdx]
    # Simulated outcome for each intervention "patient"
    yPred[1,stepIdx] = sample( x=c(0,1), prob=c(1-pDeath1,pDeath1), size=1 )
    # Probability for complication/death for each "patient" in control group:
    pDeath2 = theta2Sample[stepIdx]
    # Simulated outcome for each control "patient"
    yPred[2,stepIdx] = sample( x=c(0,1), prob=c(1-pDeath2,pDeath2), size=1 )
}

# Now determine the proportion of times that the intervention group has no complication/death
# (y1 == 0) and the control group does have a complication or death (y2 == 1))
(pY1eq0andY2eq1 = sum( yPred[1,]==0 & yPred[2,]==1 ) / chainLength)
(pY1eq1andY2eq0 = sum( yPred[1,]==1 & yPred[2,]==0 ) / chainLength)
(pY1eq0andY2eq0 = sum( yPred[1,]==0 & yPred[2,]==0 ) / chainLength)
(pY10eq1andY2eq1 = sum( yPred[1,]==1 & yPred[2,]==1 ) / chainLength)

# Conclusion: in 27% of cases based on these probabilities,
# a patient in the intervention group would not have a complication,
# when a patient in control group did. 

Considerations in the Early Termination of Clinical Trials in Surgery

One of the most difficult situations when running a clinical trial is the decision to terminate the trial early. But it shouldn’t be a difficult decision. With clear stopping rules defined before the trial starts, it should be straightforward to determine when the effect size is large enough that no further patients require to be randomised to definitively answer the question.

Whether there is benefit to leaving a temporary plastic tube drain in the belly after an operation to remove the head of the pancreas is controversial. It may help diagnose and treat the potential disaster that occurs when the join between pancreas and bowel leaks. Others think that the presence of the drain may in fact make a leak more likely.

This question was tackled in an important randomised clinical trial.

A randomised prospective multicenter trial of pancreaticoduodenectomy with and without routine intraperitoneal drainage

The trial was stopped early because there were more deaths in the group who didn’t have a drain. The question that remains: was it the absence of the drain which caused the deaths? As important, was stopping the trial at this point the correct course of action?

My feeling, the lack of a drain was not definitively demonstrated to be the cause of the deaths. And I think the trial was stopped too early. Difficult issues discussed in our letter in Annals of Surgery about it.

Ethics and statistics collide in decisions relating to the early termination of clinical trials. Investigators have a fundamental responsibility to stop a trial where an excess of harm is seen in one of the arms. Decisions on stopping are not straightforward and must balance the potential risk to trial patients against the likelihood that in fact there is no difference in outcome between groups. Indeed, in early termination, the potential loss of generalizable knowledge may itself harm future patients.

We therefore read with interest the article by Van Buren and colleagues (1) and congratulate the authors on the first multicenter randomized trial on the controversial topic of surgical drains after pancreaticoduodenectomy. As the authors report, the trial was stopped by the Data Safety Monitoring Board after only 18% recruitment due to a numerical excess of deaths in the “no-drain” arm.

We would be interested in learning from the process that led to the decision to terminate the trial. A common method to monitor adverse events advocated by the CONSORT group is to define formal sequential stopping rules based on the limit of acceptable adverse event rates (2). These guidelines suggest that authors report the number of planned “looks” at the data, the statistical methods used including any formal stopping rules, and whether these were planned before trial commencement.

This information is often not included in published trial reports, even when early termination has occurred (3). We feel that in the context of important surgical trials, these guidelines should be adhered to.

Early termination can reduce the statistical power of a trial. This can be addressed by examining results as data accumulate, preferably by an independent data monitoring committee. However, performing multiple statistical examinations of accumulating data without appropriate correction can lead to erroneous results and interpretation (4). For example, if accumulating data from a trial are examined at 5 interim analyses that use a P value of 0.05, the overall false-positive rate is nearer to 19% than to the nominal 5%.

Several group sequential statistical methods are available to adjust for multiple analyses (5,6) and their use should be prespecified in the trial protocol. Stopping rules may be formed by 2 broad methods, either using a Bayesian approach to evaluate the proportion of patients with adverse effects or using a hypothesis testing approach with a sequential probability ratio test to determine whether the acceptable adverse effects rate has been exceeded. Data are compared at each interim analysis and decisions based on prespecified criteria. As an example, stopping rules for harm from a recent study used modified Haybittle-Peto boundaries of 3 SDs in the first half of the study and 2 SDs in the second half (7). The study of Van Buren and colleagues is reported to have been stopped after 18% recruitment due to an excess of 6 deaths in the “no-drain” arm. The relative risk of death at 90 days in the “no-drain” group versus the “drain” group was 3.94 (95% confidence interval, 0.87–17.90), equivalent to a difference of 1.78 SD. The primary outcome measure was any grade 2 complication or more and had a relative risk of 1.32 (5% confidence interval, 1.00–1.75), or 1.95 SD.

The decision to terminate a trial early is not based on statistics alone. Judgements must be made using all the available evidence, including the biological and clinical plausibility of harm and the findings of previous studies. Statistical considerations should therefore be used as a starting point for decisions, rather than a definitive rule.

The Data Safety Monitoring Board for the study of Van Buren and colleagues clearly felt that there was no option other than to terminate the trial. However, at least on statistical grounds, this occurred very early in the trial using conservative criteria. The question remains therefore is the totality of evidence convincing that the question posed has been unequivocally answered? We would suggest that this is not the case. In general terms, stopping a clinical trial early is a rare event that sends out a message that, because of the “sensational” effect, may have greater impact on the medical community than intended, making future studies in that area challenging.

1. Van Buren G, Bloomston M, Hughes SJ, et al. A randomised prospective multicenter trial of pancreaticoduodenectomy with and without routine intraperitoneal drainage. Ann Surg. 2014;259: 605–612.

2. Moher D, Hopewell S, Schulz KF, et al. CONSORT 2010 explanation and elaboration: updated guidelines for reporting parallel group randomised trial. BMJ. 2010;340:c869.

3. Montori VM, Devereaux PJ, Adhikari NK, et al. Randomized trials stopped early for benefit: a systematic review. JAMA. 2005;294:2203–2209.

4. Geller NL, Pocock SJ. Interim analyses in randomized clinical trials: ramifications and guidelines for practitioners. Biometrics. 1987;43:213–223.

5. Pocock SJ. When to stop a clinical trial. BMJ. 1992;305:235–240.

6. Berry DA. Interim analyses in clinical trials: classical vs. Bayesian approaches. Stat Med. 1985;4:521– 526.

7. Connolly SJ, Pogue J, Hart RG, et al. Effect of clopidogrel added to aspirin in patients with atrial fibrillation. N Engl J Med. 2009;360:2066– 2078.

Introduction of Surgical Safety Checklists in Ontario, Canada – don’t blame the study size

The recent publication of the Ontario experience in the introduction of Surgical Safety Checklists has caused a bit of a stooshie.

Checklists have consistently been shown to be associated with a reduction in death and complications following surgery. Since the publication of Atul Gawande’s seminal paper in 2009, checklists have been successfully introduced in a number of countries including Scotland. David Urbach and Nancy Baxter’s New England Journal of Medicine publication stands apart: the checklist made no difference.

Atul Gawande himself responded quickly asking two important questions. Firstly, were there sufficient patients included in the study to show a difference? Secondly, was the implementation robust and was the programme in place for long enough to expect a difference be seen.

He and others have reported the power of the study to be low – about 40% – meaning that were the study to be repeated multiple times and a true difference in mortality actually did exist, the chance of detecting it would be 40%. But power calculations performed after the event (post hoc) are completely meaningless – when no effect is seen in a study, the power is low by definition (mathsy explanation here).

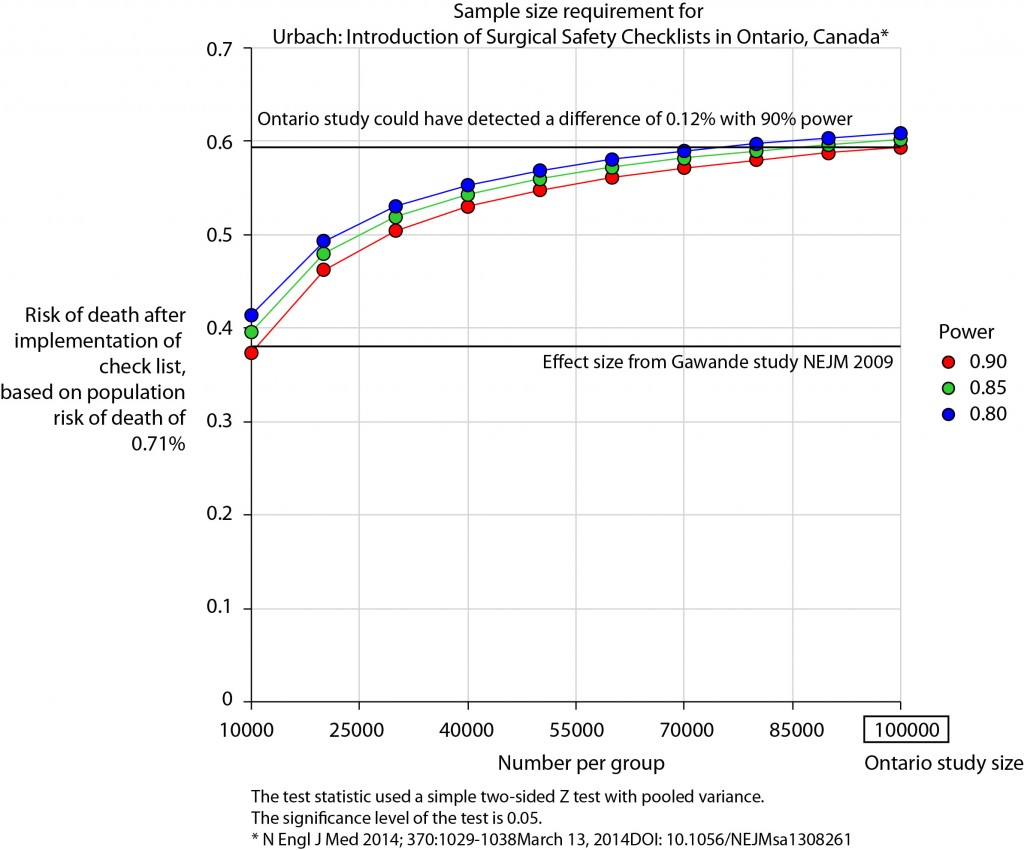
There is no protocol provided with the Ontario study, so it is not clear if an estimate of the required sample size had been performed. Were it done, it may have gone something like this.

The risk of death in the Ontario population is 0.71%. This could have been determined from the same administrative dataset that the study used. Say we expect a similar reduction in death following checklist introduction as Gawande showed in 2009, 1.5% to 0.8%. For the Ontario population, this would be equivalent to an expected risk of death of 0.38%. This may or may not be reasonable. It is not clear that the “checklist effect” is the same across patients or procedures of different risks. Accepting this assumption for now, the study would have only required around 8000 patients per group to show a significant difference. The study actually included over 100000 patients per group. In fact, it was powered to show very small differences in the risk of death – a reduction of around 0.1% would probably have been detected.

Sample size for Ontario study.

Similar conclusions can be drawn for complication rate. Gawande showed a reduction from 11% to 7%, equivalent in Ontario to a reduction from 3.86% to 2.46%. The Ontario study was likely to show a reduction to 3.59% (at 90% power).

The explanation for the failure to show a difference does not lie in the numbers.

So assuming then that checklists do work, this negative result stems either from a failure of implementation – checklists were not being used or not being used properly – or a difference in the effect of checklists in this population. The former seems most likely. The authors report that …

… available data did not permit us to determine whether a checklist was used in a particular procedure, and we were unable to measure compliance with checklists at monthly intervals in our analysis. However, reported compliance with checklists is extraordinarily high …

Quality improvement interventions need sufficient time for introduction. In this study, only a minimum of 3 months was allowed which seems crazily short. Teams need to want to do it. In my own hospital there was a lot of grumbling (including from me) before acceptance. When I worked in the Netherlands, SURPASS was introduced. In this particular hospital it was delivered via the electronic patient record. A succession of electronic “baton passes” meant that a patient could not get to the operating theatre without a comprehensive series of checklists being completed. I like this use of technology to deliver safety. With robust implementation, training, and acceptance by staff, maybe the benefits of checklists will also be seen in Ontario.

Two simple tests for summary data

R logo

Here’s two handy scripts for hypothesis testing of summary data. I seem to use these a lot when checking work:

  • Chi-squared test of association for categorical data.
  • Student’s t-test for difference in means of normally distributed data.

The actual equations are straightforward, but get involved when group sizes and variance are not equal. Why do I use these a lot?!

I wrote about a study from Hungary in which the variability in the results seemed much lower than expected. We wondered whether the authors had made a mistake in saying they were showing the standard deviation (SD), when in fact they had presented the standard error of the mean (SEM).

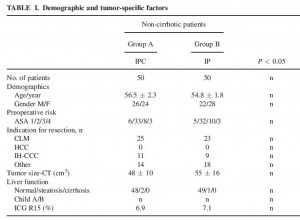
hahnThis is a bit of table 1 from the paper. It shows the differences in baseline characteristics between the treated group (IPC) and the active control group (IP). In it, they report no difference between the groups for these characteristics, p>0.05.

But taking “age” as an example and using the simple script for a Student’s t-test with these figures, the answer we get is different. Mean (SD) for group A vs. group B: 56.5 (2.3) vs. 54.8 (1.8), t=4.12, df=98, p=<0.001.

There are lots of similar examples in the paper.

Using standard error of the mean rather than standard deviation gives a non-significant difference as expected.

$latex SEM=SD/\sqrt{n}.$

See here for how to get started with R.

####################
# Chi-sq test from #
# two by two table #
####################

#           Factor 1
# Factor 2  a   |   b
#           c   |   d

a<-32
b<-6
c<-43
d<-9

m<-rbind(c(a,b), c(c,d))
m
chisq.test(m, correct = FALSE)
# Details here
help(chisq.test)

############################
# T-test from summary data #
############################

# install.packages("BSDA") # remove first "#" to install first time only
library(BSDA)
x1<-56.5     # group 1 mean
x1_sd<-2.3   # group 1 standard deviation
n1<-50       # group 1 n
x2<-54.8     # group 2 mean
x2_sd<-1.8   # group 2 standard deviation
n2<-50       # group 2 n

tsum.test(x1, x1_sd, n1, x2, x2_sd, n2, var.equal = TRUE)
# Details here
help(tsum.test)


Statistical errors in published medical studies

I do a fair amount of peer-review for journals. My totally subjective impression – which I can’t back up with figures – is that fundamental errors in data analysis occur on a fairly frequent basis. Opaque descriptions of methods and no access to raw data often makes errors difficult to detect.

We’re performing a meta-analysis at the moment. This is a study in which two or more clinical trials of the same treatment are combined. This can be useful when there is uncertainty about the effectiveness of a treatment.

Relevent trials are rigorously searched for and the quality assessed. The results of good quality trials are then combined, usually with more weight being given to the more reliable trials. This weight reflects the number of patients in the trial and, for some measures, the variability in the results. This variation is important – trials with low variability are greatly influential in the final results of the meta-analysis.

What are we doing the meta-analysis on? We often operate to remove a piece of liver due to cancer. Sometimes we have to clamp the blood supply to the liver to prevent bleeding. An obvious consequence to this is damage to the liver tissue.

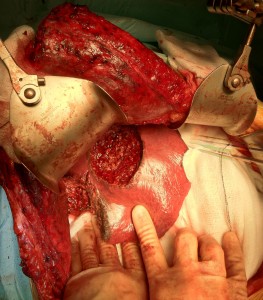
Multiple local liver resections. Patient provided consent for image publication.

It may be possible to protect the liver (and any organ) from these damaging effects by temporarily clamping the blood supply for a short time, then releasing the clamp and allowing blood to flow back in. The clamp is then replaced and the liver resection performed. This is called “ischemic preconditioning” and may work by stimulating liver cells to protect themselves. “Batten down the hatches boys, there’s a storm coming!”

Results of this technique are controversial – when used in patients some studies show it works, some show no benefit. So should we be using it in our day-to-day practice?

We searched for studies examining ischemic preconditioning and found quite a few.

One in particularly performed by surgeons in Hungary seemed to show that the technique worked very well (1).The variability in this study was low as well, so it seemed reliable. Actually the variability was very low – lower than all the other trials we found.


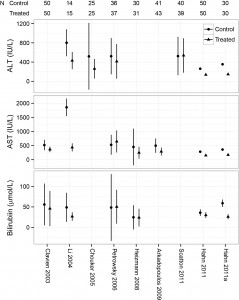
Variation in biochemical outcome measures in studies of ischemic preconditioning.

The graph shows 3 of the measures used to determine success of the preconditioning. The first two are enzymes released from damaged liver cells and the third, bilirubin, is processed by the liver. All the studies show some lowering of these measures signifying potential improvement with the treatment. But most trials show a lot of variation between different patients (the vertical lines).

Except a Hungarian study, which shows almost no variation.

Even compared with a study in which these tests were repeated between healthy individuals in the US (9), the variation was low. That seemed strange. Surely the day-to-day variation in your or my liver tests should be lower than those of a group of patients undergoing surgery?

It looks like a mistake.

It may be that the authors wrote that they used one measure of variation when they actually used another (standard error of the mean vs. standard deviation). This could be a simple mistake, the details are here.


But we don’t know. We wrote three times, but they didn’t get back to us. We asked the journal and they are looking into it.


1 Hahn O, Blázovics A, Váli L, et al. The effect of ischemic preconditioning on redox status during liver resections-randomized controlled trial. Journal of Surgical Oncology 2011;104:647–53.
2 Clavien P-A, Selzner M, Rüdiger HA, et al. A Prospective Randomized Study in 100 Consecutive Patients Undergoing Major Liver Resection With Versus Without Ischemic Preconditioning. Annals of Surgery 2003;238:843–52.
3 Li S-Q, Liang L-J, Huang J-F, et al. Ischemic preconditioning protects liver from hepatectomy under hepatic inflow occlusion for hepatocellular carcinoma patients with cirrhosis. World J Gastroenterol 2004;10:2580–4.
4 Choukèr A, Martignoni A, Schauer R, et al. Beneficial effects of ischemic preconditioning in patients undergoing hepatectomy: the role of neutrophils. Arch Surg 2005;140:129–36.
5 Petrowsky H, McCormack L, Trujillo M, et al. A Prospective, Randomized, Controlled Trial Comparing Intermittent Portal Triad Clamping Versus Ischemic Preconditioning With Continuous Clamping for Major Liver Resection. Annals of Surgery 2006;244:921–30.
6 Heizmann O, Loehe F, Volk A, et al. Ischemic preconditioning improves postoperative outcome after liver resections: a randomized controlled study. European journal of medical research 2008;13:79.
7 Arkadopoulos N, Kostopanagiotou G, Theodoraki K, et al. Ischemic Preconditioning Confers Antiapoptotic Protection During Major Hepatectomies Performed Under Combined Inflow and Outflow Exclusion of the Liver. A Randomized Clinical Trial. World J Surg 2009;33:1909–15.
8 Scatton O, Zalinski S, Jegou D, et al. Randomized clinical trial of ischaemic preconditioning in major liver resection with intermittent Pringle manoeuvre. Br J Surg 2011;98:1236–43.
9 Lazo M, Selvin E, Clark JM. Brief communication: clinical implications of short-term variability in liver function test results. Ann Intern Med 2008;148:348–52.