Publication of paediatric cardiac surgery results

The National Institute for Cardiovascular Outcomes Research (NICOR) has published the results of its investigation into mortality after paediatric heart surgery in England 2009-12.

The short report has two main findings – the quality of data collection at Leeds General Infirmary (LGI) was woeful, and differences in mortality between all hospitals are likely to be explained by natural variation.

nicor_data

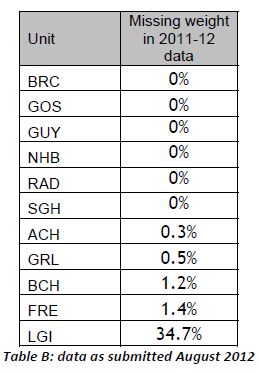
The ability of an institution to collect and audit its own results can be viewed as a measure of organisational health. As can be seen in the table, the performance of LGI in this respect was terrible, and much worse than other units. A cause for concern in itself.

On the more controversial point of whether the mortality rate in LGI was worse than other centres, no convincing proof of this has been found.

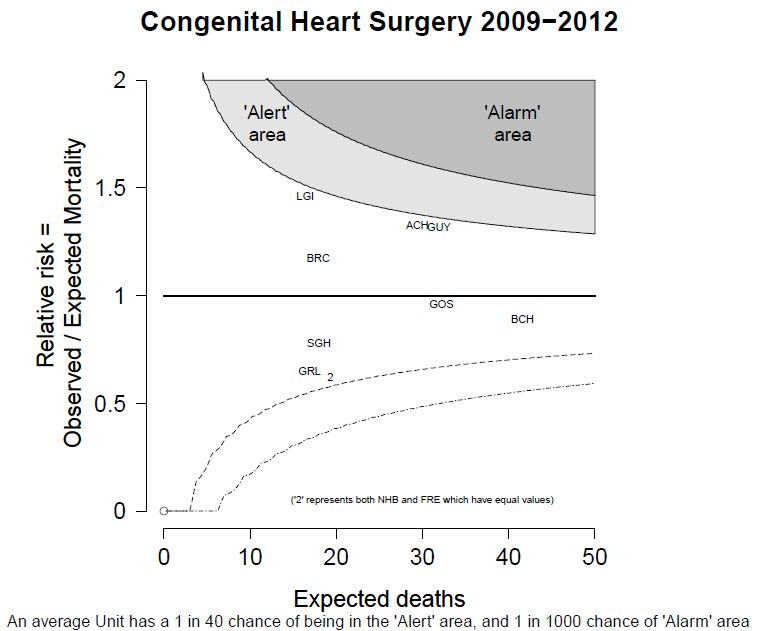
The funnel plot below shows the number of expected deaths along the bottom. Centres performing greater numbers of procedures have a greater number of expected deaths, just by common sense.

These numbers have been corrected for the difference in the types of patients and surgery performed in hospitals – the specific procedure performed, patient age, weight, diagnosis, and previous medical conditions. All these factors impact on the risk of death following surgery.

Any hospital above the black horizontal line has a greater number of deaths than predicted and any hospital below has fewer.

nicor_funnel

By “the law of averages”, it would be expected that there was a roughly equal spread of hospitals above and below the line.

As can be seen, Alder Hey, Guys, and LGI are all close to triggering an “alert”.

The report rightly states that these units “may deserve additional scrutiny and monitoring of current performance”.

The 3-year risk adjusted mortality rate in LGI is 1.47 times the national average – lower than the “twice the national average” first reported.

The unambiguous message? Data collection and real-time analysis is core business in healthcare. Government and the NHS still do not have a grip of this. There are many more stories of significant differences between hospitals, hidden in poor quality data that no one is looking at.

Mortality after paediatric heart surgery using public domain data

This post comes with some big health warnings.

The recent events in Leeds highlight the difficulties faced in judging the results of surgery by individual hospital. A clear requirement is timely access to data in a form easily digestible by the public.

Here I’ve scraped the publically available data from the central cardiac audit database (CCAD). All the data are available at the links provided and are as presented this afternoon (06/04/2013). Please read the caveats carefully.

Hospital-specific 30-day mortality data are available for certain paediatric heart surgery procedures for 2009-2012. These data are not complete for 2011-12 and there may be missing data for earlier years. There may be important data for procedures not included here that should be accounted for. There is no case-mix adjustment.

All data are included in spreadsheets below as well as the code to run the analysis yourself, to ensure no mistakes have been made. Hopefully these data will be quickly superseded with a quality-assured update.

Mortality by centre

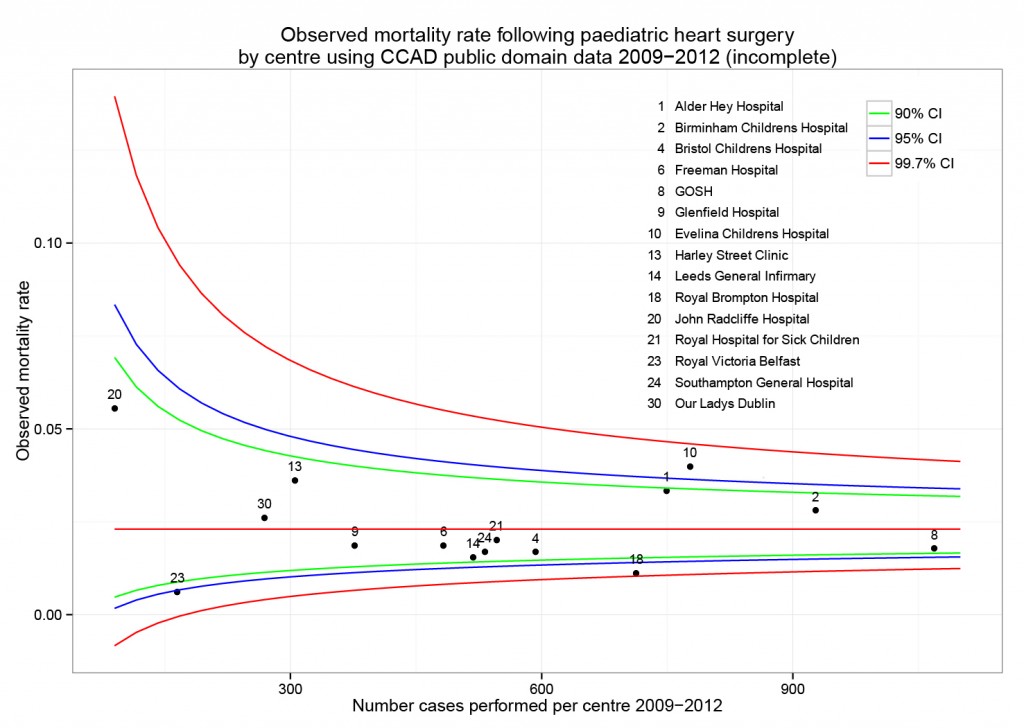
The funnel plot below has been generated by taking all surgical procedures performed from pages such as this and expressing all deaths within 30 days as a proportion of the total procedures performed by hospital.

The red horizontal line is the mean mortality rate for these procedures – 2.3%. The green, blue and red curved lines are decreasingly stringent control limits within which unit results may vary by chance.
ccad_funnel_april_2013

Mortality by procedure

The mortality associated with different procedures can be explored with this google motion chart. Note when a procedure is uncommon (to the left of the chart) the great variation seen year to year. These bouncing balls trace out the limits of a funnel plot. They highlight why year to year differences in mortality rates for rare procedures must be interpreted with caution.

[cf]googleVis[/cf]


Data

ccad_public_data_april_2013.xls

ccad_public_data_april_2013_centre

ccad_public_data_april_2013_aggregate

ccad_public_data_april_2013_lookup


Script

####################################
# CCAD public domain data analysis #
# 6 April 2013                     #
# Ewen Harrison                    #
# www.datasurg.net                 #
#################################### 

# Read data
data<-read.table("ccad_public_data_april_2013_centre.csv", sep=",", header=TRUE)

# Correct variable-type
data$centre_code<-factor(data$centre_code)

# Read centre names table
centre<-read.table("ccad_public_data_april_2013_lookup.csv", sep=",", header=TRUE)

# Combine
data<-merge(data, centre, by="centre_code")

# Subset by only procedures termed "Surgery" and remove procedures with no data. 
surg<-subset(data, type=="Surgery" & !is.na(data$centre_code))

# Display data
surg
str(surg)

# install.packages("plyr") # remove "#" first time to install
library(plyr)

# Aggregate data by centre
agg.surg<-ddply(surg, .(centre_code), summarise, observed_mr=sum(death_30d)/sum(count), 
  sum_death=sum(death_30d), count=sum(count))

# Overall mortality rate for procedures lists in all centres
mean.mort<-sum(surg$death_30d)/sum(surg$count)
mean.mort #2.3%

# Generate binomial confidence limits

# install.packages("binom") # remove "#" first time to install
library(binom)
binom_n<-seq(90, 1100, length.out=40)
ci.90<-binom.confint(mean.mort*binom_n, binom_n, conf.level = 0.90, methods = "agresti-coull")
ci.95<-binom.confint(mean.mort*binom_n, binom_n, conf.level = 0.95, methods = "agresti-coull")
ci.99<-binom.confint(mean.mort*binom_n, binom_n, conf.level = 0.997, methods = "agresti-coull")

# Plot chart
# install.packages("ggplot2") # remove "#" first time to install
library(ggplot2)
ggplot()+
	geom_point(data=agg.surg, aes(count,observed_mr))+
	geom_line(aes(ci.90$n, ci.90$lower, colour = "90% CI"))+ #hack to get legend
	geom_line(aes(ci.90$n, ci.90$upper), colour = "green")+
	geom_line(aes(ci.95$n, ci.95$lower, colour = "95% CI"))+ 
	geom_line(aes(ci.95$n, ci.95$upper), colour = "blue")+
	geom_line(aes(ci.99$n, ci.99$lower, colour = "99.7% CI"))+ 
	geom_line(aes(ci.99$n, ci.99$upper), colour = "red")+
	geom_text(data=agg.surg, aes(count,observed_mr,label=centre_code), size=3,vjust=-1)+
	geom_line(aes(x=90:1100, y=mean.mort), colour="red")+
	ggtitle("Observed mortality rate following paediatric heart surgery\nby centre using CCAD public domain data 2009-2012 (incomplete)")+
	scale_x_continuous(name="Number cases performed per centre 2009-2012", limits=c(90,1100))+
	scale_y_continuous(name="Observed mortality rate")+
	scale_colour_manual("",
		breaks=c("90% CI", "95% CI", "99.7% CI"),
		values=c("green", "blue", "red"))+
	theme_bw()+
	theme(legend.position=c(.9, .9))

# Google motion chart
# Load national aggregate data by procedure
agg_data<-read.table("ccad_public_data_april_2013_aggregate.csv", sep=",", header=TRUE)

# check
str(agg_data)

# install.packages("googleVis") # remove "#" first time to install
library(googleVis)
Motion=gvisMotionChart(agg_data, idvar="procedure", timevar="year",
	options=list(height=500, width=600,
		state='{"showTrails":true,"yZoomedDataMax":1,"iconType":"BUBBLE","orderedByY":false,"playDuration":9705.555555555555,"xZoomedIn":false,"yLambda":1,"xAxisOption":"3","nonSelectedAlpha":0.4,"xZoomedDataMin":0,"iconKeySettings":[],"yAxisOption":"5","orderedByX":false,"yZoomedIn":false,"xLambda":1,"colorOption":"2","dimensions":{"iconDimensions":["dim0"]},"duration":{"timeUnit":"Y","multiplier":1},"xZoomedDataMax":833,"uniColorForNonSelected":false,"sizeOption":"3","time":"2000","yZoomedDataMin":0.33};'),
		chartid="Survival_by_procedure_following_congenital_cardiac_surgery_in_UK_2000_2010")
plot(Motion)


Two simple tests for summary data

R logo

Here’s two handy scripts for hypothesis testing of summary data. I seem to use these a lot when checking work:

  • Chi-squared test of association for categorical data.
  • Student’s t-test for difference in means of normally distributed data.

The actual equations are straightforward, but get involved when group sizes and variance are not equal. Why do I use these a lot?!

I wrote about a study from Hungary in which the variability in the results seemed much lower than expected. We wondered whether the authors had made a mistake in saying they were showing the standard deviation (SD), when in fact they had presented the standard error of the mean (SEM).

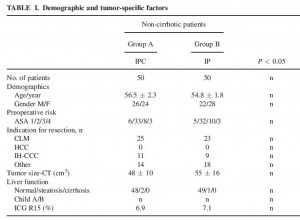
hahnThis is a bit of table 1 from the paper. It shows the differences in baseline characteristics between the treated group (IPC) and the active control group (IP). In it, they report no difference between the groups for these characteristics, p>0.05.

But taking “age” as an example and using the simple script for a Student’s t-test with these figures, the answer we get is different. Mean (SD) for group A vs. group B: 56.5 (2.3) vs. 54.8 (1.8), t=4.12, df=98, p=<0.001.

There are lots of similar examples in the paper.

Using standard error of the mean rather than standard deviation gives a non-significant difference as expected.

$latex SEM=SD/\sqrt{n}.$

See here for how to get started with R.

####################
# Chi-sq test from #
# two by two table #
####################

#           Factor 1
# Factor 2  a   |   b
#           c   |   d

a<-32
b<-6
c<-43
d<-9

m<-rbind(c(a,b), c(c,d))
m
chisq.test(m, correct = FALSE)
# Details here
help(chisq.test)

############################
# T-test from summary data #
############################

# install.packages("BSDA") # remove first "#" to install first time only
library(BSDA)
x1<-56.5     # group 1 mean
x1_sd<-2.3   # group 1 standard deviation
n1<-50       # group 1 n
x2<-54.8     # group 2 mean
x2_sd<-1.8   # group 2 standard deviation
n2<-50       # group 2 n

tsum.test(x1, x1_sd, n1, x2, x2_sd, n2, var.equal = TRUE)
# Details here
help(tsum.test)


Leeds paediatric heart surgery: managing outliers

Childrens’ heart surgery in Leeds has been suspended. Concerns about an excess in mortality have been raised and denied and I have written about seemingly large variations in mortality (“twice the national average”) being explained by chance.

In June 1998, the then Secretary of State for Health announced the establishment of an inquiry into the management of the care of children receiving complex cardiac surgery at Bristol Royal Infirmary between 1984 and 1995. The inquiry identified failures that contributed to the death children undergoing heart surgery and the 529-page report was a blueprint for wider reform of the NHS.

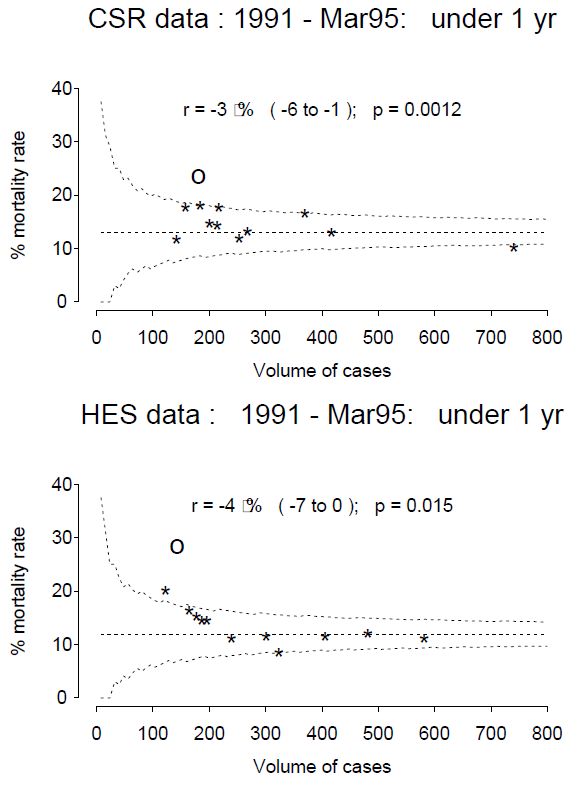
Funnel plots are useful for comparing the results of surgery between hospitals. The funnel plots below are from here and are for open cardiac surgery in children under one year in the UK 1991-1995. The Cardiac Surgery Registry (CSR) and Hospital episode statistics (HES) data were used to compare institutions. The horizontal dotted line is the national average and curved dotted line the limit of variation which might be expected by chance (95% confidence interval). The “O” is Bristol Royal Infirmary and “*” the eleven other UK centres. Bristol, as became apparent, was a clear outlier.

Funnel plots for open congenital heart surgery in chilldren under 1 year in UK 1991-1995

How should we deal with outliers?

The question is pertinent given the recent suspension of Leeds Royal Infirmary from performing children’s cardiac surgery. The UK Department of Health has produced guidelines in 2011 on the recommended process should a unit hit the dotted line, summarised below.

Stage 1 | 10 days

Hospitals with a performance indicator ‘alert’ or ‘alarm’ require scrutiny of the data handling and analyses performed to determine whether there is:

‘No case to answer’

  • potential outlier status not confirmed;
  • data and results revised in clinical audit records;
  • details formally recorded.

‘Case to answer’

  • potential outlier status;
  • proceed to stage 2.

Stage 2 | 5 days

The Lead Clinician in the hospital is informed about the potential outlier status and requested to identify any data errors or justifiable explanations. All relevant data and analyses should be made available to the Lead Clinician.

A copy of the request should also be sent to the Clinical Governance Lead of the hospital.

Stage 3 | 25 days

Lead Clinician to provide written response to national clinical audit team.

Stage 4 | 30 days

Review of Lead Clinician’s response to determine:
‘No case to answer’

  • It is confirmed that the data originally supplied by the provider contained inaccuracies. Reanalysis of accurate data no longer indicate outlier status;
  • Data and results should be revised in clinical audit records. Details of the hospital’s response and the review result recorded;
  • Lead Clinician notified in writing.

‘Case to answer’

  • It is confirmed that although the data originally supplied by the provider were inaccurate, analysis still indicates outlier status; or
  • It is confirmed that the originally supplied data were accurate, thus confirming the initial designation of outlier status;
  • proceed to stage 5.

Stage 5 | 5 days

Contact Lead Clinician by telephone, prior to written confirmation of potential outlier status; copied to clinical governance lead, medical director and chief executive. All relevant data and statistical analyses, including previous response from the lead clinician, made available to the medical director and chief executive.

Chief executive advised to inform relevant bodies about the concerns: primary care trusts, Strategic Health Authority, professional society/association, and Care Quality Commission. Informed that the audit body will proceed to publishing information of comparative performance that will identify providers.

Stage 6 | 10 days

Chief executive acknowledgement of receipt of the letter.

Stage 7

Public disclosure of comparative information that identifies providers (eg annual report of NCA).

The Situation in Leeds

It appears that in Leeds the process is at stage 2 – the local doctors have just been informed. The guidance suggests the identity of the statistical outliers should be anonymous at this stage. It may be that concerns were so great that special circumstances dictated the dramatic public announcement. We should find out in the next few weeks.

Leeds paediatric heart surgery: how much variation is acceptable?

It’s all got very messy in Leeds.

A long-term strategy of the government, supported in general by the health profession, is the concentration of high-risk uncommon surgery in fewer centres. This of course means closing departments in some hospitals currently providing those services. Few are in doubt that child heart surgery is high-risk, relatively uncommon and there are probably too many UK centres performing this highly specialised surgery at the moment. Leeds was one of three UK hospitals identified in an NHS review where congenital heart surgery would stop.

On this background and a vigorous local campaign, a case was won in the High Court which ruled the consultation flawed. That was 7th March 2013 and the ruling was published 3 days ago.

The following day, children’s heart surgery was suspended at Leeds after NHS Medical Director, Sir Bruce Keogh, was shown data suggesting that the mortality rate in Leeds was higher than expected.

There have been rumblings in the cardiac surgical community for some time that all was not well in Leeds … As medical director I couldn’t do nothing. I was really disturbed about the timing of this. I couldn’t sit back just because the timing was inconvenient, awkward or would look suspicious, as it does.

– Sir Bruce Keogh, NHS Medical Director

An “agitated cardiologist” later identified as Professor Sir Roger Boyle, director of the National Institute of Clinical Outcomes Research, told Sir Bruce that mortality rates over the last two years were “about twice the national average or more” and rising.

These data are not in the public domain. Sir Bruce and the Trust faced a difficult decision given the implications of the data. This is complicated by the recent court ruling and strength of public feeling, the recent publication of the Francis report into Mid Staffordshire NHS Foundation Trust and the background of cardiac surgery deaths at Bristol Royal Infirmary between 1984 and 1995.

Is mortality in Leeds higher than expected? What is expected? How much variation can be put down to chance? Is this how a potential outlier should be managed?

Dr John Gibbs, chairman of the Central Cardiac Database and the man responsible for the collection and analysis of the data has said the data are “not fit to be looked at by anyone outside the committee”.

It was at a very preliminary stage, and we are at the start of a long process to make sure the data was right and the methodology was correct. We would be irresponsible if we didn’t put in every effort to get the data right. It will cause untold damage for the future of audit results in this country. I think nobody will trust us again. It’s dreadful.

– Dr John Gibbs, chairman of the Central Cardiac Database

Not surprisingly, a senior cardiologist from Leeds, Elspeth Brown, has come out and said the data are just plain wrong and did not include all the relevant operations.

Twice the national average sounds a lot. is it?

Possibly. It’s difficult to know not seeing the data. Natural variation between hospitals in the results of surgery can and does occur by chance. It is possible to see “twice the national average” as a results of natural variation, disturbing as that may sound. It depends on the number of procedures performed annually – small hospitals have more variation – and whether all cardiac procedures are compared together, as opposed to each individual surgical procedure in isolation.

The challenge is in confidently detecting hospitals performing worse than would be expected by chance, as has been alleged in Leeds. Care needs to be taken to ensure that data are accurate and complete. Account is usually made of differences in the patients being treated and the complexity of the surgery performed (often referred to as case-mix).

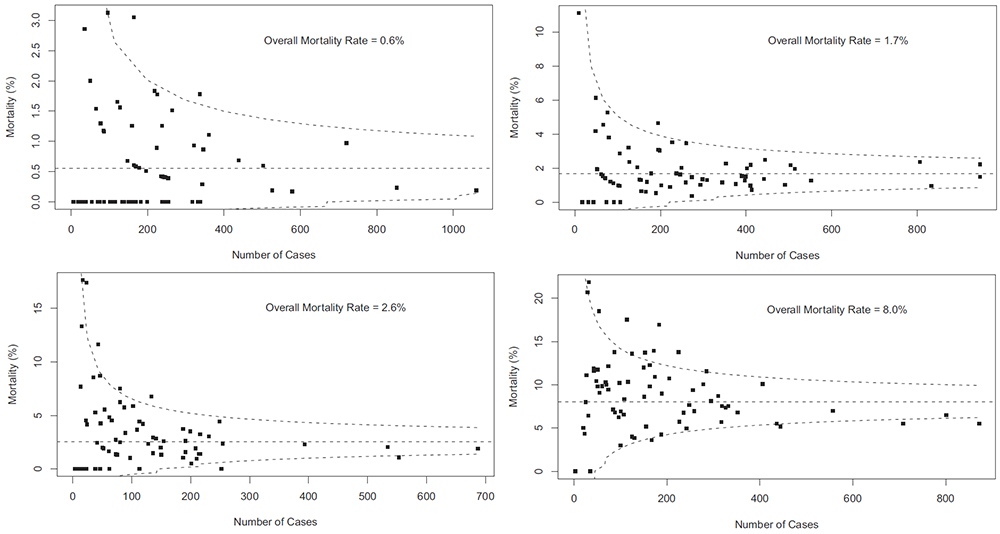
The graphs below are “funnel plots” that show differences in mortality after congenital heart surgery in US hospitals. These were published in 2012 by Jacobs and colleagues from the University of South Florida College of Medicine. The open source paper is here, but the graphs come from the final paper here which although behind a paywall, the graphs are freely available (note the final version differs from the open source version).

Each graph is for group of child heart operations of increasing complexity and therefore risk. Upper left are the more straightforward procedures, bottom right more complex. The horizontal axis is the annual number of cases and the vertical axis the mortality as a percentage. Each dot on the graph is a hospital performing that particular type of surgery. If a hospital lies outwith the dotted line (95% confidence interval) then there is a possibility that the mortality rate is different from the average. The further above the top line, the greater the chance. These particular funnel plots are not corrected for case-mix, but this has been done else where in the analysis.

It is easy to see that when a hospital does few cases per year, the natural variation in mortality can be high. On the first graph, there is variation from 0 – 3% between different hospitals and this range increases as the surgery gets riskier. There is less variation between hospitals that do more cases. However, in the second graph even the two hospitals doing around 800 procedures per year, there is a greater than two-fold difference in mortality. On the first plot, twice the national average is 1.2%. There are around 11 hospitals above that level in the US for these procedures, the differences for 9 apparently occuring by chance (within the dotted line). Similar conclusions can be drawn from the other graphs of increasingly risky surgery.

Funnel plots of US centres performing congenital cardiac surgery

Data for cardiac sugery is published and freely available to the public. At the moment, data for children’s heart surgery is not published separately. The data for Leeds General Surgery can be seen here.

To compare children’s heart surgery in Leeds with other centres, we need to the raw data presented in this form and the data corrected for differences in patients. Other issues may be at play, but with the data in the public domain we will be in a better position to make a judgement as to whether an excess in mortality does indeed exist.