An alternative presentation of the ProPublica Surgeon Scorecard

ProPublica, an independent investigative journalism organisation, have published surgeon-level complications rates based on Medicare data. I have already highlighted problems with the reporting of the data: surgeons are described as having a “high adjusted rate of complications” if they fall in the red-zone, despite there being too little data to say whether this has happened by chance.

4
This surgeon should not be identified as having a “high adjusted rate of complications” as there are too few cases to estimate the complication rate accurately.

I say again, I fully support transparency and public access to healthcare. But the ProPublica reporting has been quite shocking. I’m not aware of them publishing the number of surgeons out of the 17000 that are statistically different to the average. This is a small handful.

ProPublica could have chosen a different approach. This is a funnel plot and I’ve written about them before.

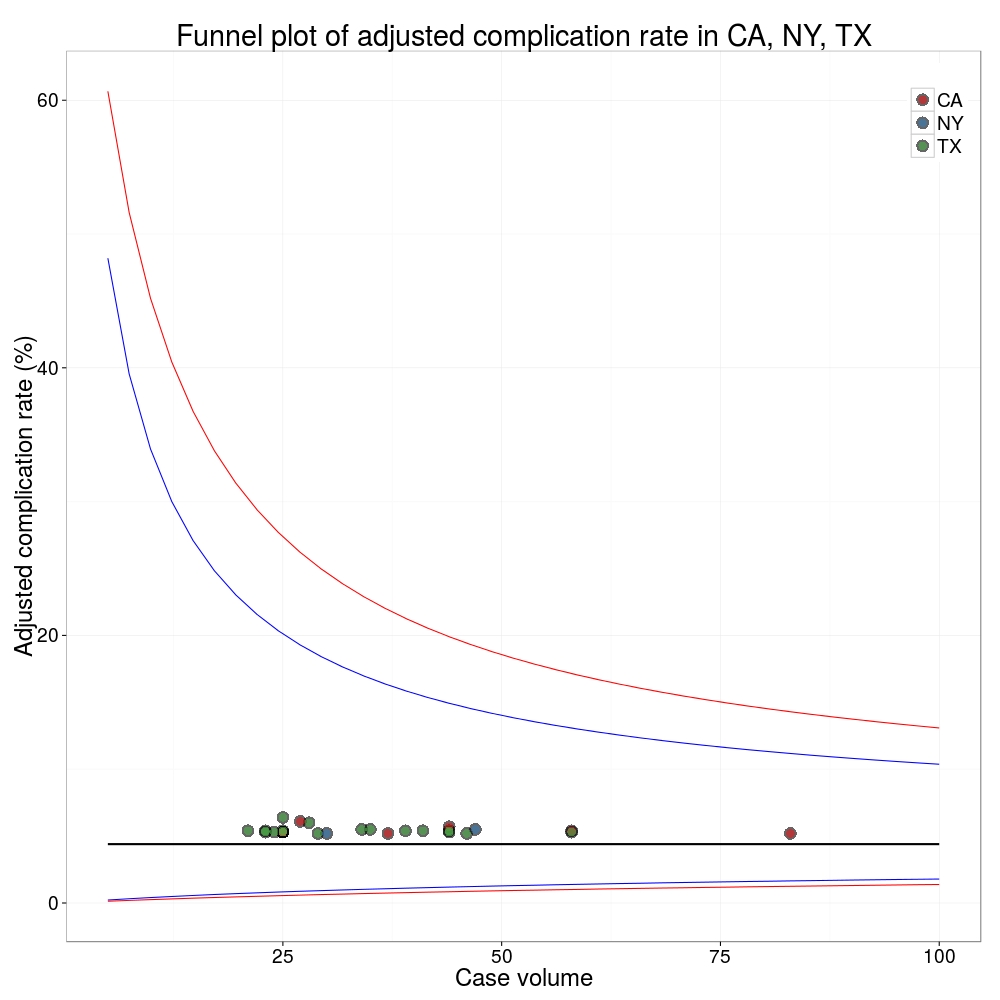
A funnel plot is a summary of an estimate (such as complication rate) against a measure of the precision of that estimate. In the context of healthcare, a centre or individual outcome is often plotted against patient volume. A horizontal line parallel to the x-axis represents the outcome for the entire population and outcomes for individual surgeons are displayed as points around this. This allows a comparison of individuals with that of the population average, while accounting for the increasing certainty surrounding that outcome as the sample size increases. Limits can be determined, beyond which the chances of getting an individual outcome are low if that individual were really part of the whole population.

In other words, a surgeon above the line has a complication rate different to the average.

I’ve scraped the ProPublica data for gallbladder removal (laparoscopic cholecystectomy) from California, New York and Texas for surgeons highlighted in the red-zone. These are surgeons ProPublica says have high complication rates.

As can be seen from the funnel plot, these surgeons are no where near being outliers. There is insufficient information to say whether any of them are different to average. ProPublica decided to ignore the imprecision with which the complication rates are determined. For red-zone surgeons from these 3 states, none of them have complication rates different to average.

ProPublica_lap_chole_funnel
Black line, population average (4.4%), blue line 95% control limit, red line 99% control limit.

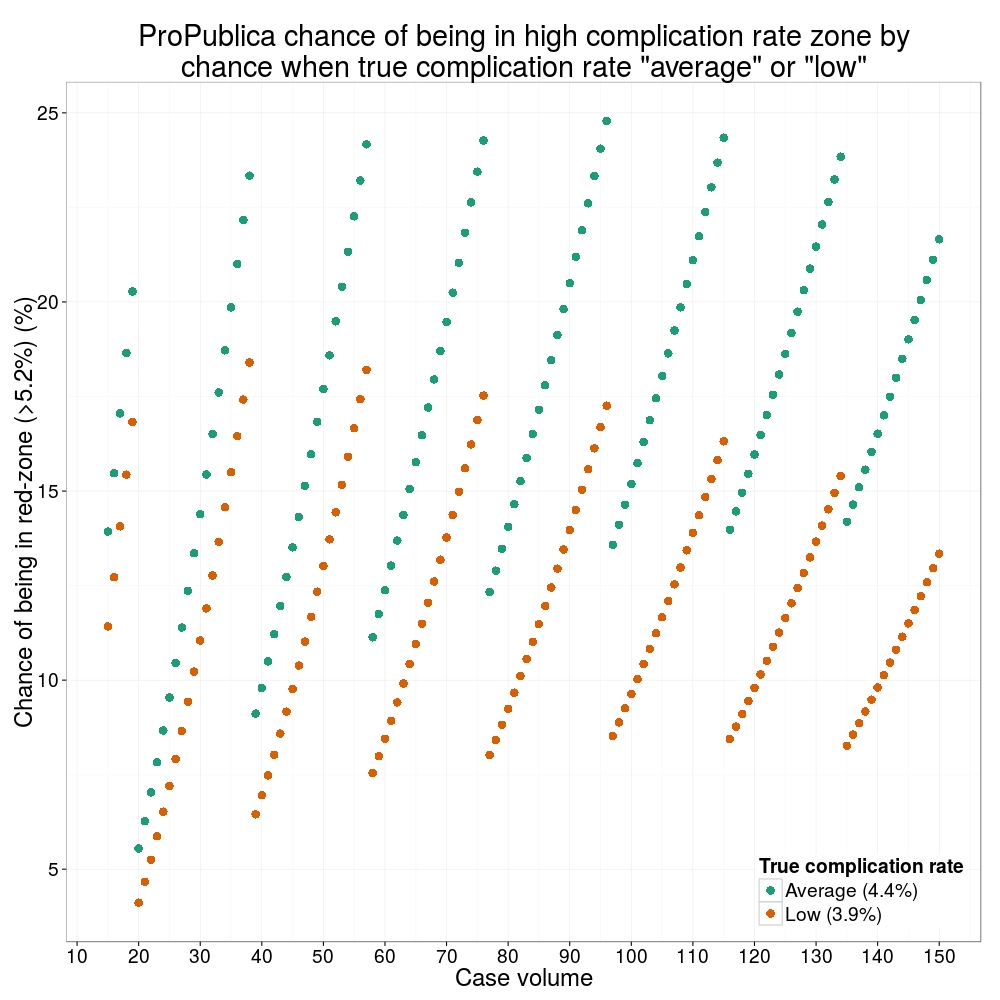
How likely is it that a surgeon with an average complication rate (4.4%) will appear in the red-zone just by chance (>5.2%)? The answer is, pretty likely given the small numbers of cases here: anything up to a 25% chance depending on the number of cases performed. Even at the top of the green-zone (low ACR, 3.9%), there is still around a 1 in 6 chance a surgeon will appear to have a high complication rate just by chance.

chance_of_being_in_redzoneProPublica have failed in their duty to explain these data in a way that can be understood. The surgeon score card should be revised. All “warning explanation points” should be removed for those other than the truly outlying cases.

Data

Download

Git

Link to repository.

Code

# ProPublica Surgeon Scorecard 
# https://projects.propublica.org/surgeons

# Laparoscopic cholecystectomy (gallbladder removal) data
# Surgeons with "high adjusted rate of complications"
# CA, NY, TX only

# Libraries needed ----
library(ggplot2)
library(binom)

# Upload dataframe ----
dat = read.csv("http://www.datasurg.net/wp-content/uploads/2015/07/ProPublica_CA_NY_TX.csv")

# Total number reported
dim(dat)[1] # 59

# Remove duplicate surgeons who operate in more than one hospital
duplicates = which(
    duplicated(dat$Surgeon)
)

dat_unique = dat[-duplicates,]
dim(dat_unique) # 27

# Funnel plot for gallbladder removal adjusted complication rate -------------------------
# Set up blank funnel plot ----
# Set control limits
pop.rate = 0.044 # Mean population ACR, 4.4%
binom_n = seq(5, 100, length.out=40)
ci.90 = binom.confint(pop.rate*binom_n, binom_n, conf.level = 0.90, methods = "wilson")
ci.95 = binom.confint(pop.rate*binom_n, binom_n, conf.level = 0.95, methods = "wilson")
ci.99 = binom.confint(pop.rate*binom_n, binom_n, conf.level = 0.99, methods = "wilson")

theme_set(theme_bw(24))
g1 = ggplot()+
    geom_line(data=ci.95, aes(ci.95$n, ci.95$lower*100), colour = "blue")+ 
    geom_line(data=ci.95, aes(ci.95$n, ci.95$upper*100), colour = "blue")+
    geom_line(data=ci.99, aes(ci.99$n, ci.99$lower*100), colour = "red")+ 
    geom_line(data=ci.99, aes(ci.99$n, ci.99$upper*100), colour = "red")+
    geom_line(aes(x=ci.90$n, y=pop.rate*100), colour="black", size=1)+
    xlab("Case volume")+
    ylab("Adjusted complication rate (%)")+
    scale_colour_brewer("", type = "qual", palette = 6)+
    theme(legend.justification=c(1,1), legend.position=c(1,1))
g1

g1 + 
    geom_point(data=dat_unique, aes(x=Volume, y=ACR), colour="black", alpha=0.6, size = 6, 
                         show_guide=TRUE)+
    geom_point(data=dat_unique, aes(x=Volume, y=ACR, colour=State), alpha=0.6, size=4) +
    ggtitle("Funnel plot of adjusted complication rate in CA, NY, TX")


# Probability of being shown as having high complication rate ----
# At 4.4%, what are the changes of being 5.2% by chance?
n <- seq(15, 150, 1)
average = 1-pbinom(ceiling(n*0.052), n, 0.044)
low = 1-pbinom(ceiling(n*0.052), n, 0.039)

dat_prob = data.frame(n, average, low)

ggplot(melt(dat_prob, id="n"))+
    geom_point(aes(x=n, y=value*100, colour=variable), size=4)+
    scale_x_continuous("Case volume", breaks=seq(10, 150, 10))+
    ylab("Adjusted complication rate (%)")+
    scale_colour_brewer("True complication rate", type="qual", palette = 2, labels=c("Average (4.4%)", "Low (3.9%)"))+
    ggtitle("ProPublica chance of being in high complication rate zone by\nchance when true complication rate \"average\" or \"low\"")+
    theme(legend.position=c(1,0), legend.justification=c(1,0))

Life expectancy of acute hospital inpatients

I liked the study published this week by David Clark and Christopher Isles.

On 31st March 2010 there were 10,743 inpatients in 25 Scottish teaching and general hospitals.

One year later 3098 (29%) were dead.

That sounds a lot and is a lot. As the authors point out, the study is biased to long term inpatients as it is a prevalent sample (those in hospital) rather than an incident sample (those admitted to hospital). The latter would be more informative to us in surgery.

Another important observation: of those that died, 32% did so during the index admission.

Our acute hospitals are not set up to be good places to die. They could and should be better.

The focus of care may too often be cure, doctors treating illnesses rather than patients. We are fortunate to have excellent palliative care services within our hospital, but the recent media outrage on the Liverpool Care Pathway has left many clinicians uncertain when looking after patients at the end of life. There is no lack of compassion, but a definite of education. This must improve if care is to get better.

Finally, the study reports in the abstract and throughout that men were more likely to die than women. It is unusual that neither the authors, reviewers nor editors picked up that this statement is based on a non-significant result, odds ratio: 1.18, 95% confidence interval: 0.95–1.47. There is no gender effect in the final model.

Landmark Papers in General Surgery: Review

A longer version of my review in Surgeons’ News.

When should a clinical study be considered a landmark? Must it have changed practice? Does the strength of the study have a bearing – should only randomised clinical trials be considered, for instance? The new Landmark Papers series from Oxford University Press has volumes in Neurosurgery, Cardiovascular Medicine and Nephrology. A book covering General Surgery from authors based mainly in Glasgow is hot off the press.

The editors have done a great job in producing a clean, well-structured, easy to read book that will be of use to both practising surgeons and trainees. The book is divided by general surgery subspecialty with each chapter containing a number of themes. In emergency surgery, for instance, sections include CT assessment of the acute abdomen and laparoscopic versus open appendicectomy. An important study addressing the theme is provided, sometimes together with related references. Following a brief description, study design and results are tabulated, after which conclusions and a critique are made.

Before opening the book I wondered whether there may be a problem in its conception: in the modern world of the systematic review and meta-analysis, what is the place of a book in which surgeons highlight a single publication in a deliberately unsystematic manner? Is this not harking back to the days when one cites evidence fitting ones prejudices, ignoring troublesome contradictory reports?

9780199644254_450Actually, rather than a problem, I found this refreshing. This analysis of individual trials in a detailed manner is reminiscent of the journal clubs we struggle to maintain in our busy modern practice. Despite being an advocate for the systematic review, too often the focus is on the certainty surrounding a point estimate of outcome. This book highlights the importance of clear consideration of the intention of a trial, whether those aims were achieved, what biases exist and ultimately whether the results apply to my patients or not. In any case, in areas where conflict exists, multiple trials are often described and the balance of interpretation discussed in the critique.

Another concern was that it would date almost as soon as it was published. With 140 000 citations being returned from the Pubmed database for an all-fields search for “surgery” in 2012, how can a static publication like this hope to remain relevant? Again, on the whole this concern was unfounded. A condensation of the evidence for surgery, such as this, shows that the pace of change is slower than we possibly recognise. While the majority of included trials are from the last 15 years, there are fewer than I expected from, say, the last 4 years.

A publication such as this puts itself up there to be criticised for the omission of studies deemed important by a reviewer, and it would be remiss of me not to comply. Actually, the editors have done a good job and irritatingly I found it difficult to identify big omissions. On pulling up the top 50 most cited papers in surgery, I found the great majority had been included. In my own (small field), the landmark paper by Mazzaferro on the surgical treatment of hepatocellular carcinoma has been cited more than most other surgical papers (2400 times) and warrants inclusion. The classification of surgical complications by Dindo and Clavien is at number 11 in my top 50 and probably deserves mention.

The editors have achieved their aim with this book and I would recommend it unreservedly. Minor niggles are the truncated “et al” citations – give us the whole citation so we can see the senior author please. No graphs are included which is fine, but where the main study is a meta-analysis, including the forest plot for the primary outcome measure conveys information better than a table. Finally, is there a digital version of this book? I circled the Oxford website in vein but could not find a page where it is possible to buy one.

Must a landmark paper have changed practice? No, as illustrated by the neat discussion on the GALA (general versus local anaesthetic in carotid endarterectomy) trial – an example of a landmark randomised trial that has not changed practice. Must a landmark paper be an RCT? No, as the classic level 4 evidence for total mesorectal excision by Bill Heald demonstrates – some observational studies have done more to alter practice in surgery than many RCTs.